 Biostatistics is the development and application of statistical methods to a wide range of topics in biology and medicine. It encompasses the design of biological experiments, the collection and analysis of data from those experiments and the interpretation of the results. It is not possible to take the measures from all the elements of a population. Because of that, the sampling process is very important for statistical inference.
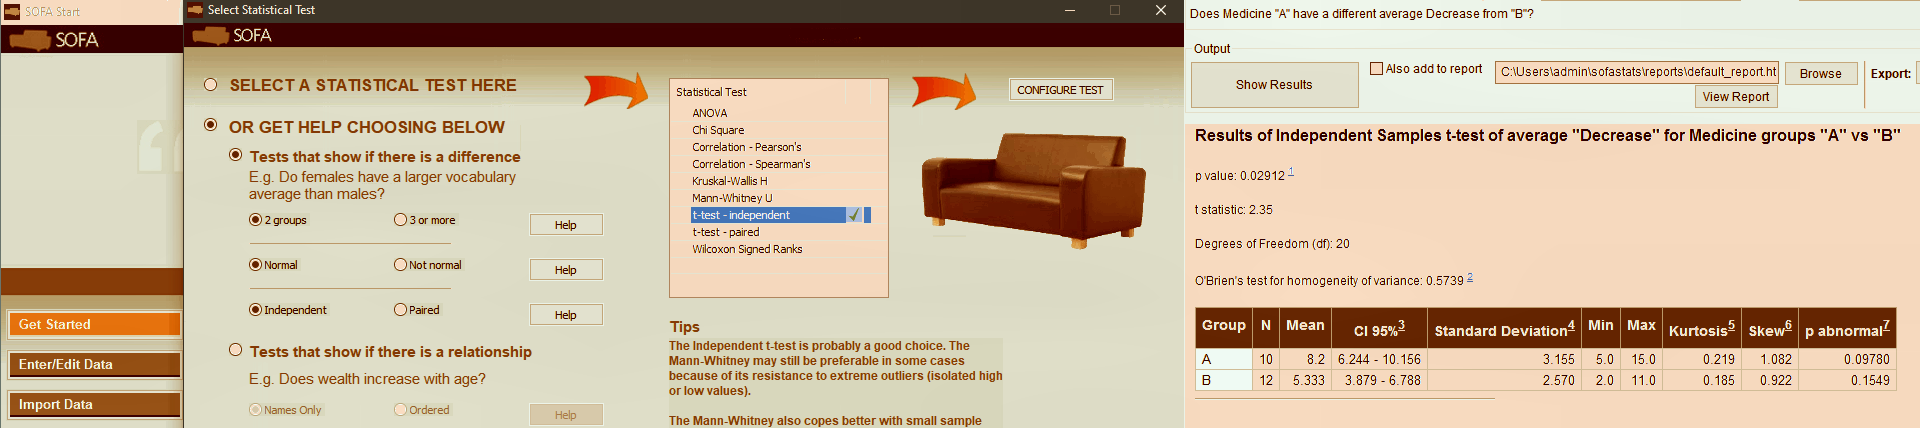
SOFA Statistics is an open-source statistical package which will be mostly used for this introductory stats course (see the content below). The name stands for Statistics Open For All. SOFA Statistics is written in Python. It has a graphical user interface. Data can be imported from CSV and Tab-Separated files or spreadsheets (Microsoft Excel, LibreOffice Calc, Gnumeric, Google Docs). Installation packages are available for Microsoft Windows, Ubuntu, ArchLinux, Linux Mint, and macOS (Leopard upwards). As of now, however, SOFA will not install on the newest macOS Catalina (successor to macOS Mojave) which is the first version of macOS to support only 64-bit applications. SOFA is very user-friendly and has a great online user guide as well as lots of instructive videos by Dr. Grant Paton-Simpson (Lead Developer) and J. David Eisenberg (instructor and programmer).
If you have not downloaded SOFA statistical package yet, I recommend you go visit the official SOFA download page!
Let us go practice (video lectures only for registered users):
- Descriptive Medical Statistics - part 1
(go to course video lectures)
Basic concepts and ideas. Statistical nomenclature. Statistical sampling. Sampling error. Variables. Scales of measurement.
Measures of central tendency (mean, median, mode) and their relationship in normal, skewed and bimodal distributions.
- Descriptive Medical Statistics - part 2
(go to course video lectures)
Measures of data dispersion (variability): range, variance, standard deviation, coefficient of variation.
Graphical presentation of statistical data (histogram, cumulative histogram). Experimental study design.
Prospective clinical study (correlation vs. causation).
Using spreadsheet software (LibreOffice Calc) to calculate descriptive statistical parameters.
- Introduction to Statistical Inference - part 1
(go to course video lectures)
Unique properties of Normal Distribution. Population mean μ and standard deviation σ. Three-sigma rule of thumb.
Frequency vs. Probability. An idea of Sampling Distribution. Statistical interpretation of Clinical Reference Range.
- Introduction to Statistical Inference - part 2
(go to course video lectures)
Better understanding the concept of Sampling Distribution of the Sample Mean. Central Limit Theorem. Standard Error of the Mean (SEM).
Pseudorandom number generator. Computer simulation of statistical sampling.
- Introduction to Statistical Inference - part 3
(go to course video lectures)
Three-sigma rule for Sampling Distribution. Confidence Interval. Significance level (Alpha error = 5%).
Comparing Two Sampling Distributions looking for significant difference (intuitive approach). Interpreting computed outcome: p-value vs. significance level (0.05).
Null hypothesis H0 and alternative hypothesis HA. Normality issue: parametric and nonparametric statistical tests.
- Introduction to Statistical Inference - part 4
(go to course video lectures)
Comparison of Two Groups using SOFA (worked example). Independent vs. paired data sets.
Clinical interpretation of statistical test result!!!
- Comparison of Two Groups - part 1
(go to course video lectures)
Statistical caveats of comparing two groups: more detailed mechanics of statistical inference (not for the faint of heart! :-).
Homogeneity of variance (homoscedasticity): pooled vs. unpooled t-test (the Welch t-test). Power of statistical test.
- Comparison of Two Groups - part 2
(go to course video lectures)
Two-tailed vs. one-tailed test. Student's t-distribution as compared to normal distribution.
Paired data model explained. Normality issue.
- Comparison of Two Groups - part 3
(go to course video lectures)
Normality in practice (worked examples!). Comparison of Two Groups in a nutshell.
Statistical Inference Protocol: How to talk to SOFA (practical guide).
- Comparison of Two Groups - part 4 !!!
(go to course video lectures)
Worked examples: tests for independent or paired data.
Parametric tests (normal distribution and interval scale), nonparametric tests (not normal distribution or ordinal scale).
Clinical interpretation of the test result (practical approach).
- Comparison of Three or More Groups - part 1
(go to course video lectures)
Theoretical introduction. Why you should not perform multiple tests for comparison of two groups.
Newton's binomial coefficient. Compounding statistical error...
Parametric tests: ANOVA explained!!! Post-hoc Tukey's Honest Significant Difference test.
Variability between groups vs. variability within groups. F-statistic. Fisher–Snedecor distribution.
Nonparametric tests: The Kruskal–Wallis H test (one-way ANOVA on ranks). Post-hoc Dunn's test.
Scientific vs. standard notation of the p-value. Rounding off rule.
- Comparison of Three or More Groups - part 2
(go to course video lectures)
Worked examples: comparison of more than two groups (parametric and nonparametric) using SOFA Statistics and STATISTICA.
Clinical interpretation of the p-value in case it is crawling up to the significance level of 0.05.
- Bivariate Correlation - part 1
(video lecture)
Understanding covariance. Correlation coefficient vs. covariance. Pearson's correlation (parametric) vs. Spearman's correlation (nonparametric).
Clinical interpretation of correlation analysis (correlation coefficient vs. p-value). Graphical visualization of relationship between variables.
Correlation does not mean causation!
- Bivariate Correlation - part 2
(video lecture)
Worked examples with commentary. Interpretation of r-value as weak, moderate, and strong correlation (practical approach).
Courtesy of:
Narcyz Knap MD PhD, Mariusz Baran PhD, Dariusz Świetlik PhD
Intrafaculty College of Medical Informatics & Biostatistics
Medical University of Gdansk, Poland
")
")